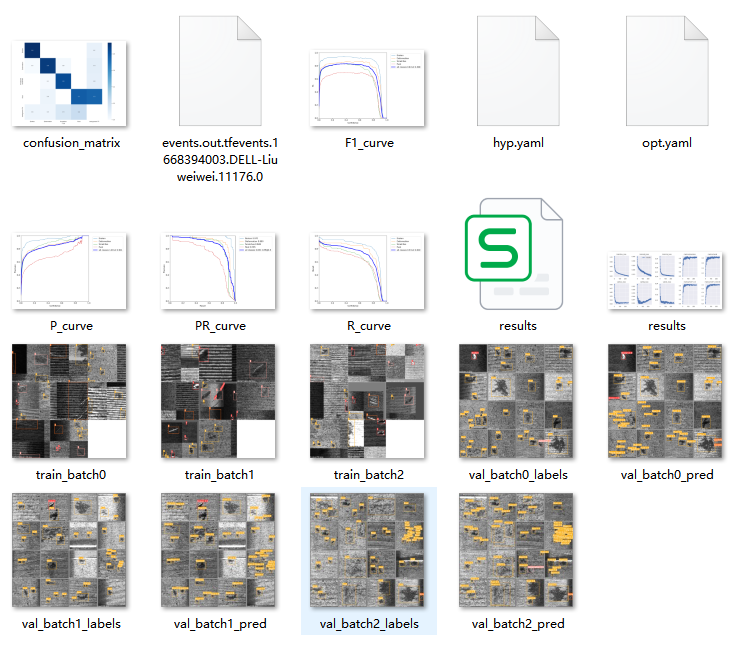
Use the damage data files in the 3-3 shaftData folder for training, and output the key data for the evaluation of the detection model. The experimental environment is as follows: deep learning open source framework Pytorch, Windows 10, Python 3.9, Intel Xeon Gold 6230R processor, and NVIDIA Quadro RTX5000 graphics processing unit (GPU) with 16 GB memory; All kinds of key data can be used to evaluate whether there is underfitting or overfitting phenomenon in model training, and the performance of yolov5 single-stage damage detection model with bidirectional weighted structure can be comprehensively evaluated by various kinds of overall average accuracy.
Since the contents are much the same, take the yolov5_BiFPN folder as an example
1
png is the confusion_matrix. PNG is the model confusion matrix, and the horizontal coordinate is the category of the real label of the loss target, and the vertical coordinate is the category predicted by the loss target in the detection model. The color depth of the Chinese block in the matrix represents the accuracy of the model output damage prediction results
(2) F1_curve.png is the F1 score of each category and the whole. The F1 score is calculated by model accuracy and recall rate, which can objectively evaluate the prediction effect of the model
png, R_curve.png and PR_curve.png are accuracy and recall rate curves, respectively. The area enclosed by the curve of PR_curve and coordinate axis is the overall average accuracy of each type of damage
(4) results.cvs is the data parameter of each cycle output during model training
(5) results.png is the curve fitted by the data parameters of each cycle output during model training


