名称 : 焰流温度对比图
英文名称 : Flame flow temperature comparison chart
材料 : 431
委托单位 : 中国人民解放军军事科学院国防科技创新研究院
实验单位 : 中国人民解放军军事科学院国防科技创新研究院
实验方法 : 无方法
实验设备 : 无设备
实验条件 : 无条件
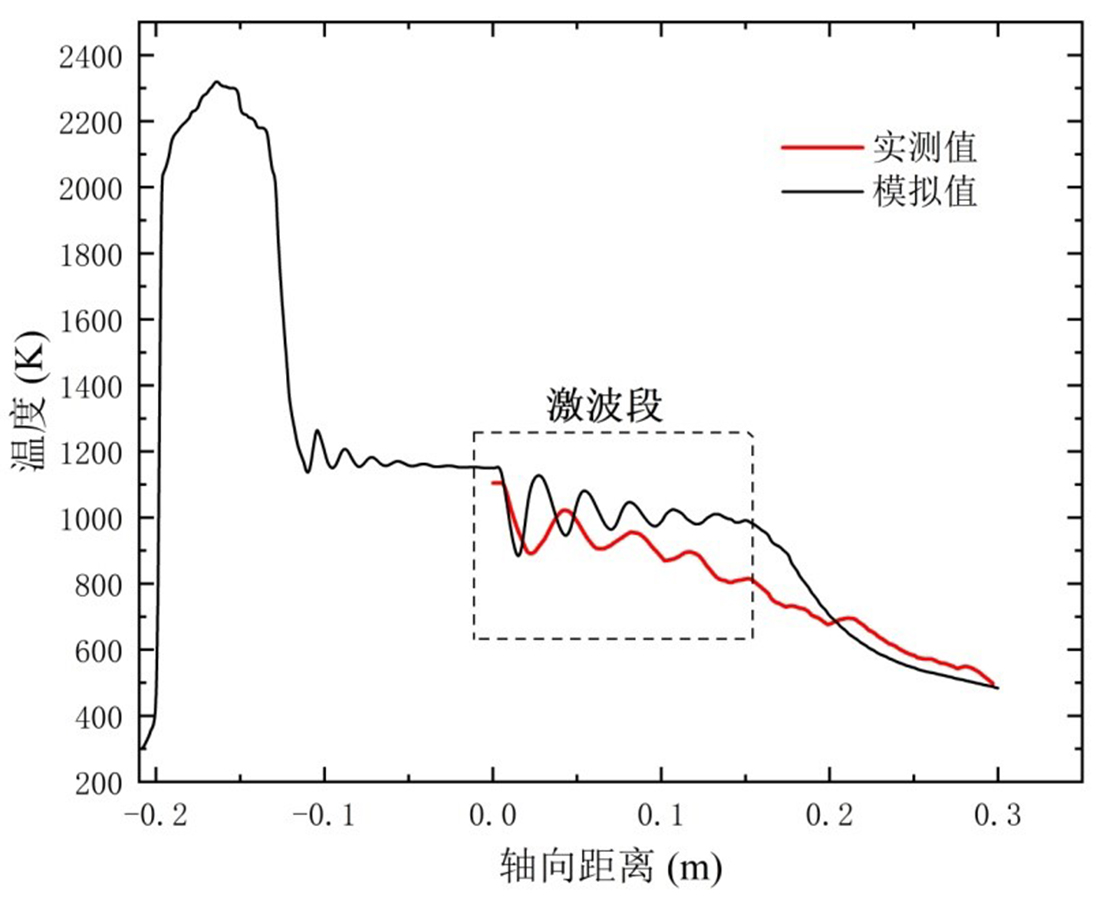
说明 : 将焰流实测温度进行提取与整理,对比数值模拟结果,并绘制温度曲线图,如图所示。从图中可以发现,实测温度值与模拟温度值变化规律基本一致。经计算,0-0.3 m喷涂距离内焰流的模拟温度平均值为839.19 K,实测温度平均值为784.41 K,误差率约为7%,由于数值模拟中空气域设置理想化,因此焰流的温度保持性较好,而实验中考虑到环境温度较低、温度不稳定等实际因素,实测焰流温度下降的相对明显。
英文说明 : The actual measured temperature of the flame flow is extracted and sorted, the numerical simulation results are compared, and the temperature profile is plotted as shown in Fig. From the graph, it can be found that the measured temperature value and the simulated temperature value change pattern is basically the same. It is calculated that the average simulated temperature of the flame stream within the spray distance of 0-0.3 m is 839.19 K, and the average measured temperature is 784.41 K. The error rate is about 7%, and the temperature of the flame stream is well maintained because of the idealized air domain setting in the numerical simulation, while the actual factors such as low ambient temperature and temperature instability are considered in the experiment, and the measured flame stream temperature drops relatively obviously.
数据来源 : 分析测试报告
重点项目名称 : 废旧重型装备损伤检测与再制造形性调控技术
项目所属数据集 : 低温高速火焰喷涂系统搭建与测试数据数据集